This tutorial will guide you through the steps to set up online tracking using Navigine. Online tracking is a feature that allows you to monitor the real-time location of your devices, assets, and people in a specific location.
¶ Step 1: Log in to your Navigine account.
Please visit sign in to your account.
¶ Step 2: Upload Image of Floor Plan
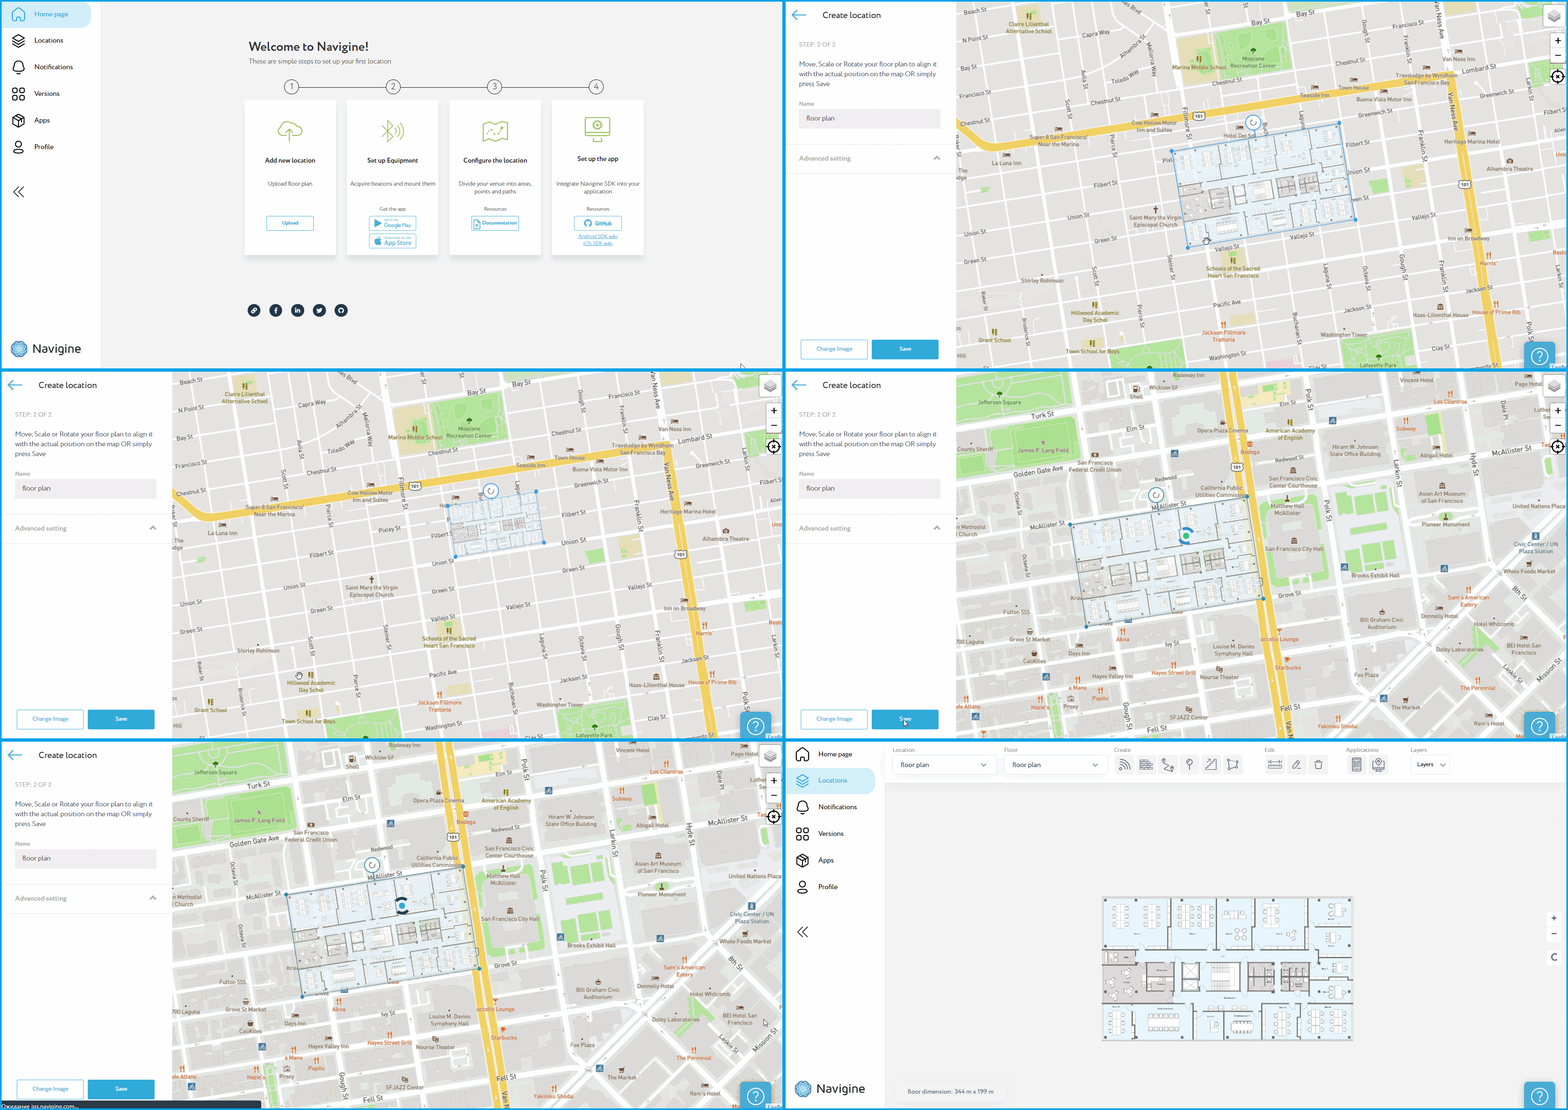
The first step in setting up a location-based tracking system is to upload an image of the floor plan. This will serve as the basis for all subsequent steps, including adding locators, drawing barriers, and creating zones. To access a more detailed manual, check this page.
¶ Step 3: Add Transmitter
Next, you need to add the transmitter that will receive data from your devices and transmit it to the Navigine server. For that go to the Locations tab and click on the Add Transmitter button on the top bar. This will open a new window where you can select the type of transmitter you want to use and enter its settings. To access a more detailed manual, check this page.
![]()
¶ Step 4: Draw Barriers on Closed Locations and Walls
After uploading the floor plan, the next step is to draw barriers on closed locations and walls. Barriers define areas of the floor plan that are off-limits to navigation and will help to ensure that the navigation system accurately reflects the layout of the building. To access a more detailed manual, check this page.
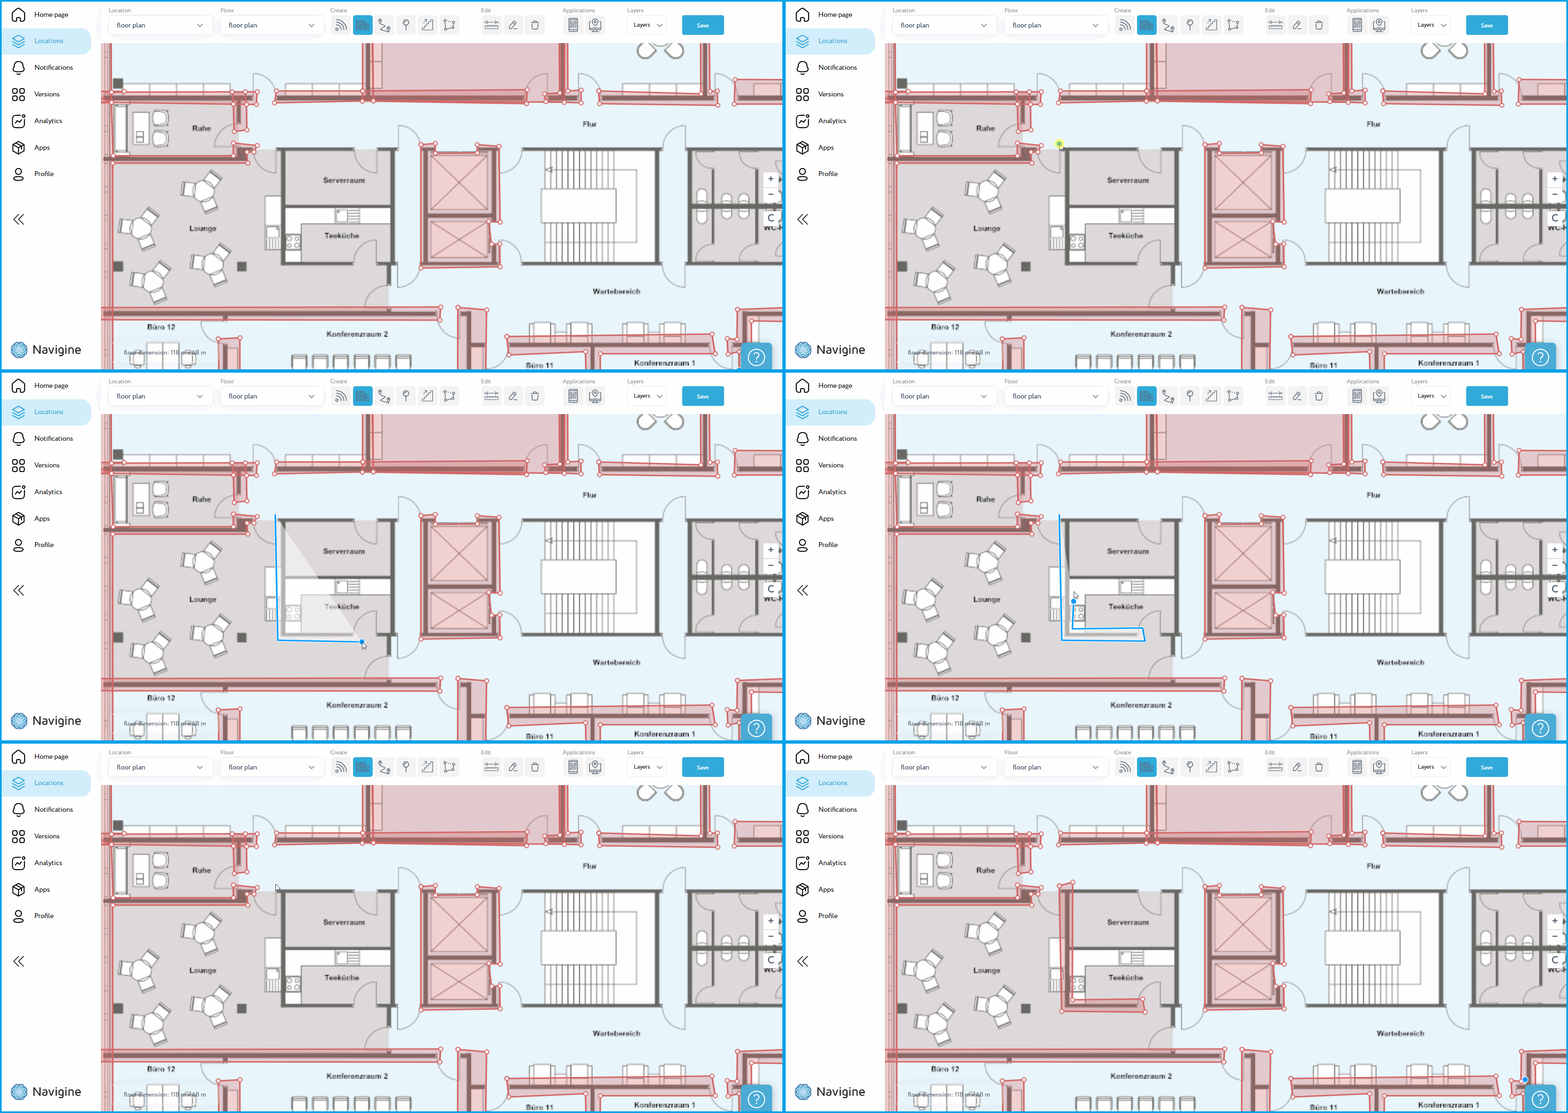
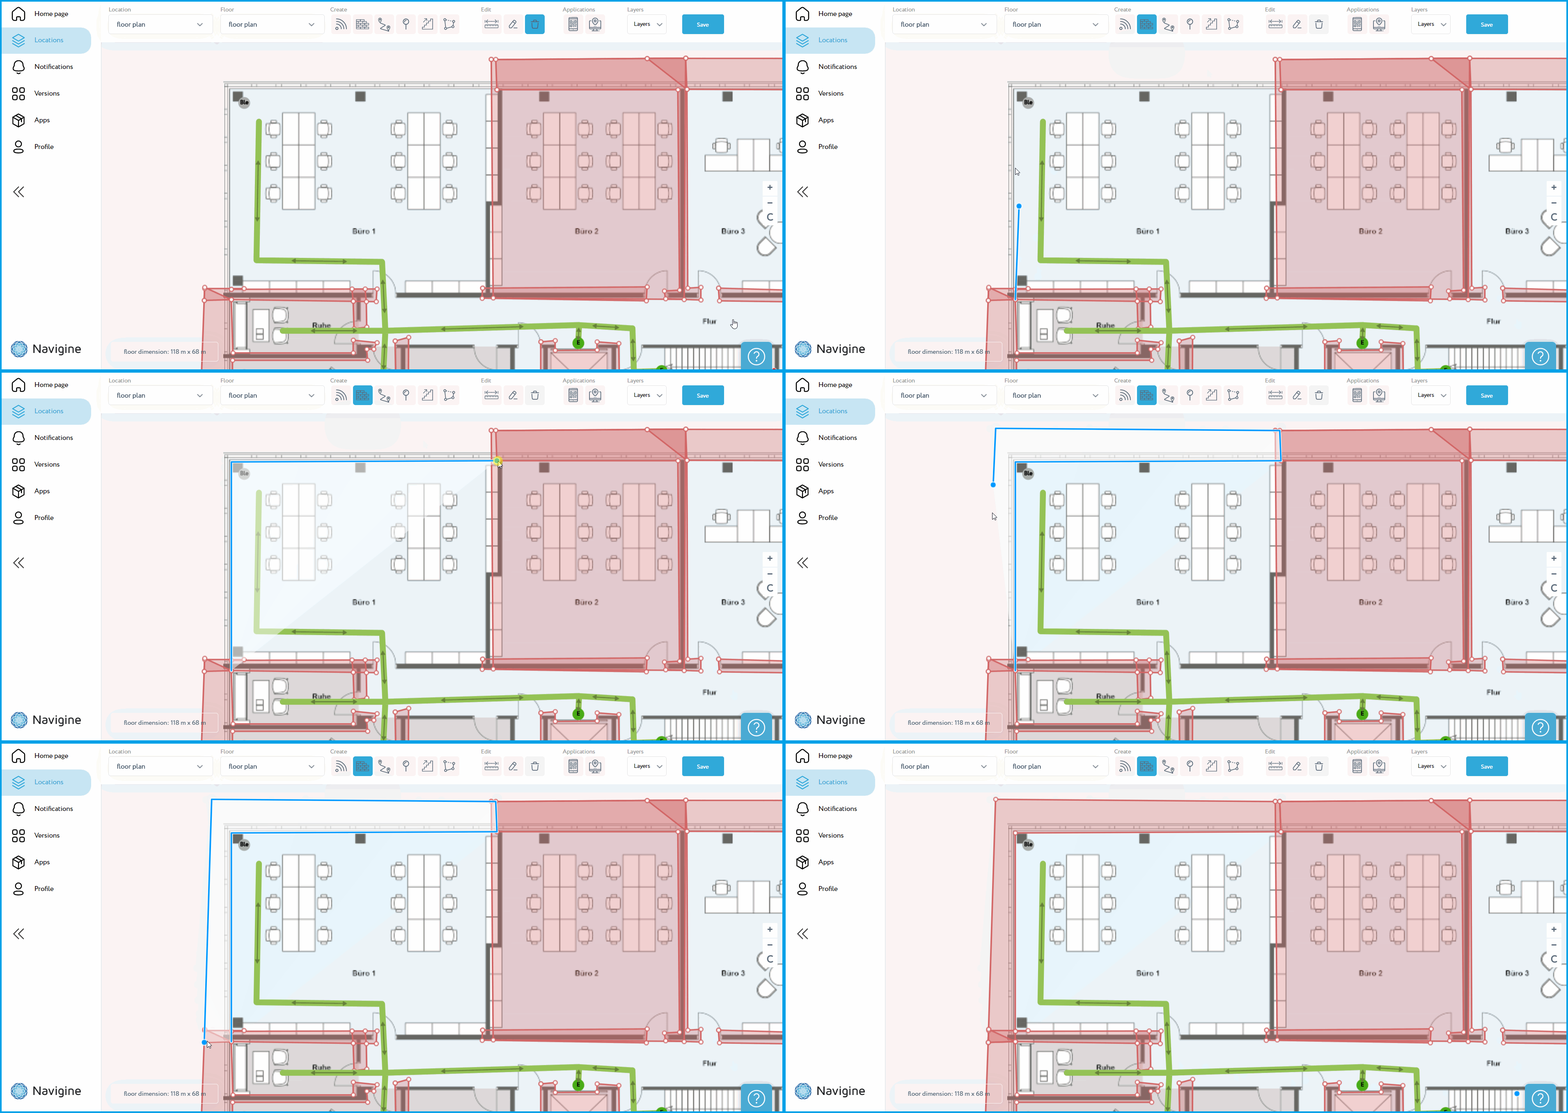
NOTE: To ensure the accuracy of your indoor navigation, it is important to properly overlay barriers on your floor plan. This will prevent the navigation from going outside the boundaries of the image. When you draw a new barrier, make sure it is placed within the borders of the floor plan image as on pic 3.
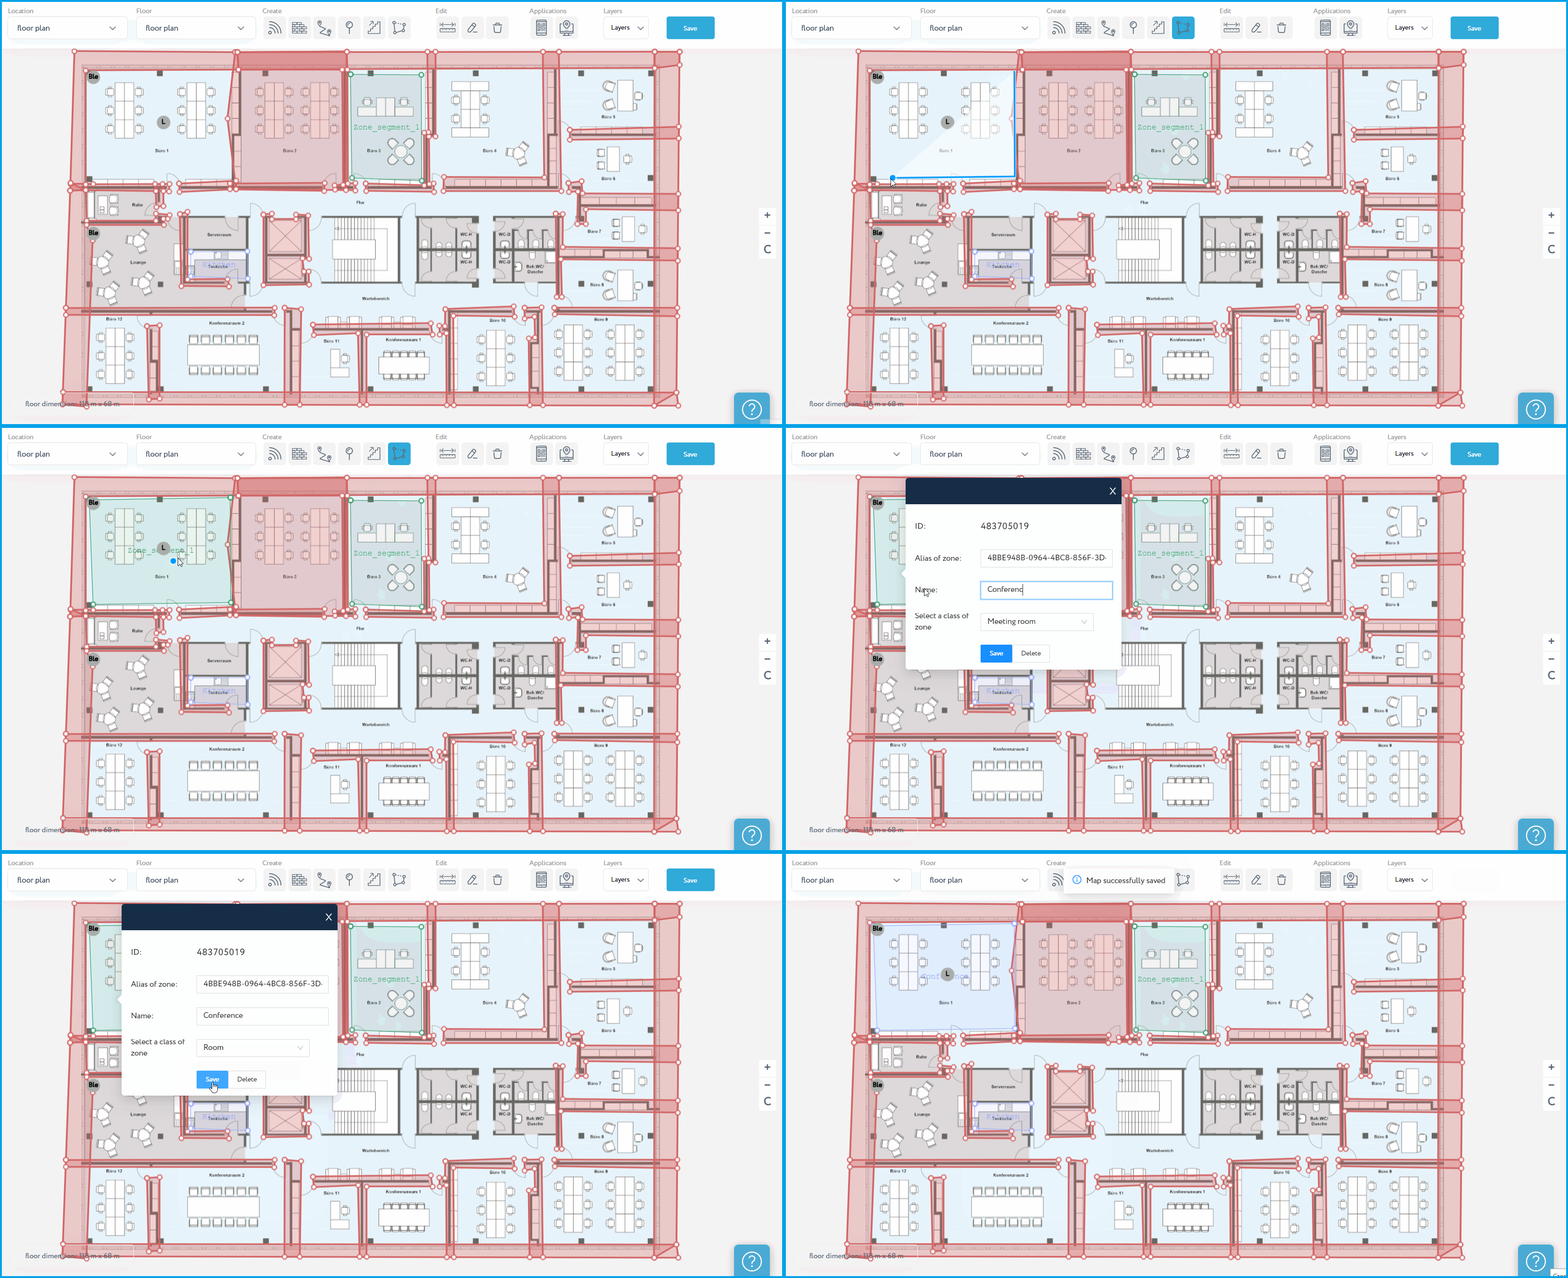
¶ Step 5: Draw zones
If desired, users can draw zones. By creating zones, users can easily see specific locations where people are. To access a more detailed manual, check this page.
¶ Step 6: Go to Apps tab
Navigate to the Apps tab and click on the "Add Apps" button. Enter the desired name for the application and flip the switch to enable it. Once you have completed this step, scroll down to the "Locations" section, select the location you wish to add, and click the "Add" button.
![]()
¶ Step 7: Go to RTLS platform
Once you have configured the gateway, you need to access the Navigine server to set up online tracking. To do this, go to rtls.navigine.com and log in to your account.
![]()
![]()
¶ Step 8: Add objects
Navigate to the Settings tab and select the Object tab. From there, click on the "Create object" button. Enter the object's name, type, and the corresponding UUID of the device. After filling in all the tabs, click on the "Save" button to create an object. To access a more detailed manual, check this page.
![]()
¶ Step 9: Go to Online tracking tab
Check the Online tracking tab to see the objects appear and if everything is correct.
![]()
¶ Additional options: Add notifications
- Open the Notifications tab
- Click the Create notification button
![]()
- Set up the notification parameters such as title, description, interval, priority, and when the should be invoked.
- Location - Locations list;
- Sublocation - Sublocation list;
- Zone - Zones are specific areas that you can set up to trigger notifications;
- Groups - select which group should receive the notifications;
- Priority - Notification hierarchy of priorities. The priority rises as the value decreases. If the same beacon is the target of several notification messages, the notification with the highest hierarchy position appears first. The remaining notification messages will show up one by one with a 10-second wait. There are Low, Medium and High priority.
- Notification type - circumstance under which the notification should be displayed
Entry to zone - This occurs when an employee enters the designated area
Quit from zone - This happens when an employee leaves the zone.
Standing in zone - If an employee stays in the zone for a specific amount of time, a notification is triggered.
Staying out of zone - If an employee stays out of a zone for a certain period of time, a notification is generated.
SOS - This is activated when the emergency button is pressed.
FALL - This occurs when the device falls.
![]()
- To complete the process of creating a new notification, simply click on the "Create Notification" button.
![]()
¶ Additional options: Add reports
¶ To activate reports on the Reports tab in Tracking, follow these steps:
- Navigate to the Locations Apps tab.
- Click on Options and select "Add option".
![]()
- Choose the type "Report" and key as the report you need, and set the value to "True".
![]()
![]()
¶ Types of reports
- Object report - shows the time an employee spent in different zones during a selected time period. If the employee's movements were not recorded, the report will be empty.
![]()
- Inventory report - shows when an employee entered, exited, how much time they spent in each zone, and the total time spent in each zone during the selected period of time.
![]()
- Notification report - shows when an employee entered, exited, or was found in a zone. Notifications are generated based on this report.
![]()
- Contacts by zone - shows the filtered time spent by an employee in a zone, entry time for each zone, and the total time spent in each zone during the selected period of time.
![]()
- Device monitoring - shows the devices that are online.
![]()
- Distance traveled - shows the distance that the employee has traveled during the selected period of time, displayed as a distance measurement.
![]()
- Work day picture - shows the paths taken by the employee during the selected period of time, represented as a line.
![]()
- Heat map - displays where employees or objects spent the most time on location.
![]()
- Number of Devices - shows the number of devices that were active in a certain location.
![]()
- Zone report - displays the percentage of time that the employee spent in each zone.
![]()